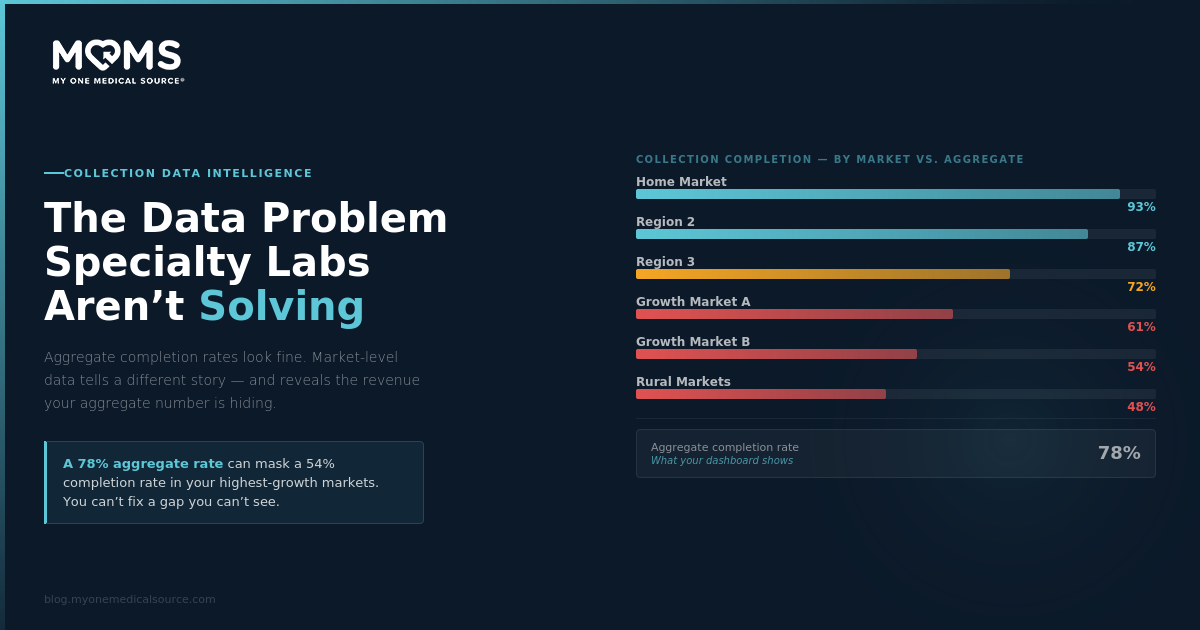
Most specialty labs manage their collection performance against one number.
An aggregate completion rate. The percentage of orders that resulted in a completed draw, across all markets, all test categories, all draw site partners, combined into a single metric that shows up in monthly operations reporting.
That number is almost always misleading — not because it's inaccurate, but because it hides the geography.
The problem with this data
A specialty lab with a 78% aggregate completion rate might be running at 92% in its home market, 85% in three adjacent states where it has strong draw site relationships, and 54% in four markets where it has ben trying to grow physician relationships for the last two years.
The 78% aggregate looks acceptable. The 54% market-level data — if the lab could see it — would be disqualifying for any commercial initiative in those geographies.
The aggregate completion rate tells a lab how it's doing overall. Market level data tells it where it's losing — and what closing those specific gaps would produce.
Most specialty labs don't have market-level collection data. Not because they lack the operational sophistication to produce it, but because the tools they've used to manage collection — individual draw site relationships, informal check-ins, periodic reconciliation against order volumes — weren't designed to generate geographic granularity.
The result is a data blindspot that affects commercial decisions in ways most labs never fully trace back to collection performance.
What the blindspot costs
Commercial targeting built on incomplete information
A lab's commercial team invests significant effort in physician relationship development. They identify target markets, build outreach plans, allocate sales resources toward the geographies where ordering volume justifies the investment.
If the collection completion data for those target markets isn't visible — if the commercial team is targeting geographies where collection infrastructure will fail to complete a meaningful fraction of the orders those relationships generate — the investment in physician development is producing less revenue than it should.
A 20% collection gap in a physician's primary patient geography doesn't show up in the CRM as a collection problem. It shows up as an ordering physician whose volume is lower than projected, or a market that underperformed its commercial model. The root cause is a collection data gap the commercial team didn't know to look for.
New test launches that underperform without explanation
When a specialty lab launches a new test and the first 90 days of ordering data comes back below model, the post-mortem typically focuses on clinical positioning, physician education, payer coverage, and sales execution.
The question that often doesn't get asked: what was the collection completion rate in the markets where orders were placed?
A test launched into a national market with uneven collection coverage will systematically underperform in the geographies where that coverage is weakest — not because the test's clinical value is lower there, but because a meaningful share of the orders placed don't result in specimens. The launch data reflects an access-impaired version of the test's commercial performance, not the actual clinical utility.
Labs that launch into confirmed collection coverage consistently see stronger early-stage adoption data than labs that discover their coverage gaps post-launch. The clinical performance of the test doesn't change. The access performance of the infrastructure does.
Revenue recovery opportunities that stay invisible
The most direct financial consequence of the collection data blindspot is revenue that could be recovered without acquiring a single new client or launching a single new test.
A lab processing 2,500 monthly orders at $150 average value with a 75% aggregate completion rate is leaving $93,750 per month on the table from orders it already has — $1.125 million annually. If its market-level data showed that 40% of that gap is concentrated in three specific markets where collection coverage is weak, closing the infrastructure gap in those markets would recover $450,000 in annual revenue from work the lab's commercial team already did.
That recovery opportunity is invisible as long as the data is aggregate. It becomes a specific, actionable infrastructure decision the moment the geography is visible.
What market-level collection visibility changes
The labs that have developed market-level collection visibility — whether through their own data infrastructure or through tools like the MOMS coverage assessment — describe consistent changes in how they make commercial decisions.
- Commercial targeting becomes sharper. Geographies worth physician relationship investment are the ones where collection completion can support the volume those relationships would generate.
- Launch strategies get scoped correctly. A new test enters markets where collection coverage is confirmed, not assumed — and coverage gaps get addressed before the first order, not after the first disappointing quarter.
- Revenue recovery becomes concrete. The gap between ordered and realized revenue stops being a general problem and becomes a specific number in a specific market that a specific infrastructure decision can address. Physician retention conversations change. When a lab can tell an ordering physician exactly what its collection coverage looks like in the markets where that physician's patients live, the relationship becomes one built on demonstrated access rather than assumed capability.
Where to see MOMS MAP coverage
The MOMS MAP network covers all 50 states, including rural counties, smaller MSAs, and underserved markets where collection access has historically been thinnest. Labs can view the MAP network coverage at any time by visiting our website here: MAP Network Coverage.
The interactive map shows where active MAPs are located across the country. Labs use it to understand which markets already have qualified collection professionals available and where they may need to build new connections. The coverage map reflects the current state of the MOMS MAP network.
For most specialty labs, viewing the geographic distribution of the MAP network alongside their own ordering markets is a useful starting point for understanding where MOMS can support their collection needs — and where new MAP connections would be most valuable.