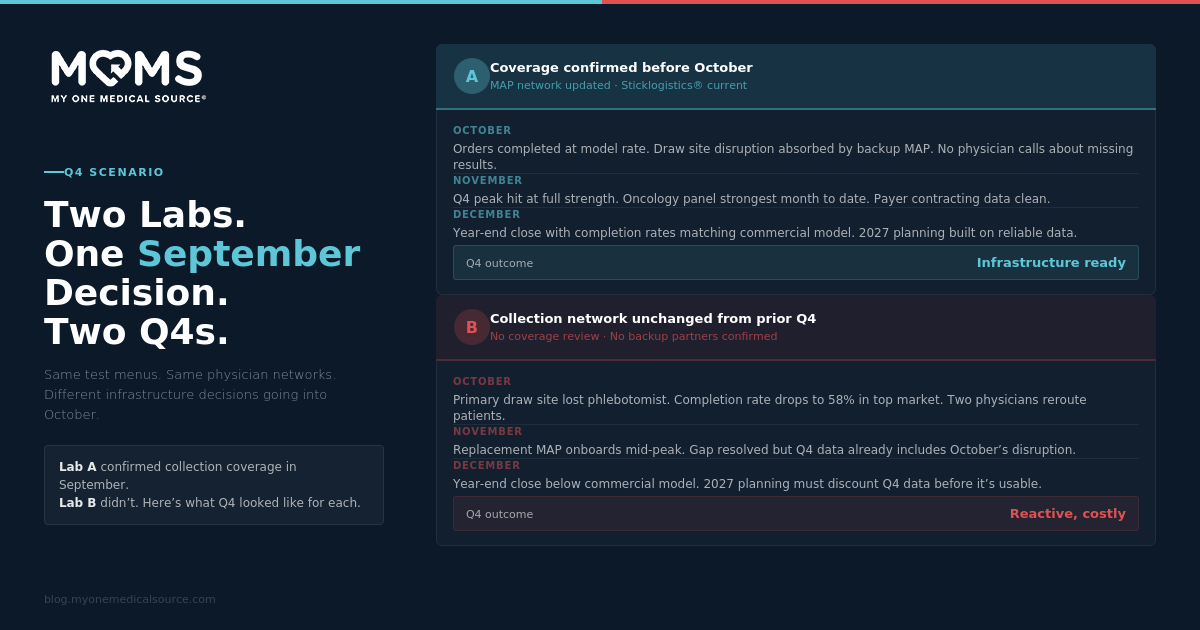
Two specialty labs. Similar test menus. Similar ordering physician networks. Both entered October with Q4 commercial plans that projected meaningful growth.
One had spent September confirming collection coverage across its top 20 markets, completing Sticklogistics® training updates on three protocols, and adding MAP partners in two markets where its primary draw site relationships had reduced capacity.
The other hadn't updated its collection infrastructure since the previous Q4.
By December, the performance gap between them was visible in the data. This is what Q4 looked like for each.
Lab A: Collection infrastructure confirmed before Q4
October
Lab A's Q4 ordering volume came in as projected. Orders placed in the geographies where it had confirmed MAP coverage resulted in completed draws at a rate that matched the lab's commercial model. Physician offices in those markets didn't call about results that hadn't arrived. The sales team spent October focused on new physician relationships rather than managing exceptions from existing ones.
One draw site partner in a mid-size market reduced its phlebotomy hours without notice. Because Lab A had identified a backup MAP in that market during its September coverage review, the disruption didn't create a collection gap. Orders routed to the backup partner. Results arrived on schedule.
November
The Q4 ordering peak that typically runs mid-November through mid-December hit Lab A's commercial operations at full strength. Year-end insurance benefit utilization drove ordering volume up across most of its test categories. The collection infrastructure was ready for it.
Lab A's oncology panel, which had been in active commercialization for six months, had its strongest ordering month to date. The completion data from November went into the payer contracting conversation Lab A was preparing for January — clean data showing consistent completion rates across geographies.
December
Year-end. Lab A closed Q4 with completion rates within a few percentage points of its commercial model. Revenue realized from Q4 orders matched planned Q4 revenue more closely than in previous years. The ordering physicians who had been routing the highest-value year-end panels to Lab A continued doing so.
The data going into year-end reporting was clean. The 2027 commercial planning had a reliable baseline.
Lab B: Collection infrastructure unchanged from prior Q4
October
Lab B's October started with a problem it hadn't anticipated. A draw site partner in one of its top three markets had lost its primary phlebotomist in September. The partner was still technically active, but collection capacity was reduced and scheduling delays had extended from days to more than a week.
Orders placed in that market began completing at a rate below 60%. The physicians routing patients to Lab B in that geography started getting calls from patients who couldn't get appointments. Two of those physicians began routing similar patients to a competitor.
Lab B identified the problem in its October operations review. By then, the market had been underperforming for three weeks. Finding and onboarding a replacement draw site partner would take four to six weeks.
November
Lab B's replacement MAP in the affected market completed onboarding in mid-November. The draw site capacity issue was resolved — but three weeks into the Q4 peak. The physicians who had rerouted patients in October didn't immediately come back.
Elsewhere in Lab B's network, Q4 volume increased as expected. But the aggregate completion rate for Q4 was being dragged down by October's performance in the affected market. The quarterly data that would go into payer contracting conversations and year-end analysis reflected an access problem that had already been resolved — but the data didn't know that.
December
Lab B closed Q4 with aggregate completion rates below its commercial model. Revenue realized was lower than projected. Two ordering physician relationships in the affected market were softer than they had been entering Q4. The year-end commercial planning was built on Q4 data that included a three-week disruption the planning team would have to explain, qualify, and discount to produce a reliable 2027 baseline.
The difference
Lab A and Lab B faced similar Q4 conditions. Same ordering volume trends. Same seasonal peak. Same payer environment. Same competitive landscape.
The difference was a September infrastructure decision.
Lab A spent September doing the coverage review, updating the MAP network, and confirming backup partners for markets with known fragility. Lab B didn't. When the Q4 conditions arrived, Lab A's infrastructure was ready for them. Lab B's wasn't — and the gap opened in October took the better part of Q4 to close.
Collection infrastructure isn't a Q4 decision. It's a September decision with Q4 consequences.
The MAPs behind the difference
The story above is told from the lab's perspective because that's where the business consequences land. But the infrastructure difference that produced it is made of people.
The backup MAP that Lab A had confirmed in its fragile market before October is the person who showed up when the primary draw site lost capacity. The collector who had completed Sticklogistics® training on Lab A's specific protocols before Q4 began is the person who completed those draws correctly when the volume peak arrived.
Every collection infrastructure decision is also a decision about which patients will have a qualified collector available to them when they schedule a draw. The Lab B patients who couldn't get appointments in that October market weren't statistics in a completion rate. They were people whose physicians had ordered tests they needed and who couldn't complete them because the infrastructure wasn't there.
Building collection infrastructure before Q4 is a business decision. It's also a patient access decision.
The September window, closing
The window to be operational before Q4's peak is closing. Labs that start the MOMS onboarding process this week can be operational in time for November. Labs that wait until October will be closing infrastructure gaps while the peak is already running.
The MOMS MAP Network spans all 50 states, including DC, Puerto Rico and the US Virgin Islands. Our coverage map can be found on our website here. Take a look at your markets of need and perform a coverage assessment. It only takes a few minutes and can show the specific markets where a lab's collection infrastructure has the same fragility that caught Lab B in October. The decision of what to do with that information is the lab's.
But the information itself — the market-level picture of where coverage is confirmed versus where it's assumed — is the thing most labs don't have going into Q4.